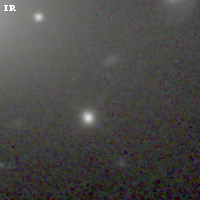
ABELL1763 IR detection object #501
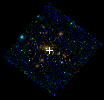
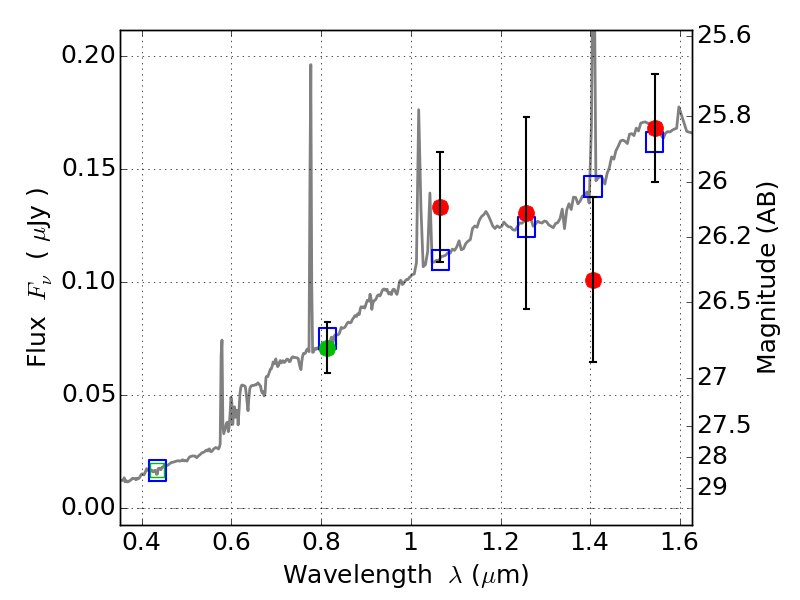
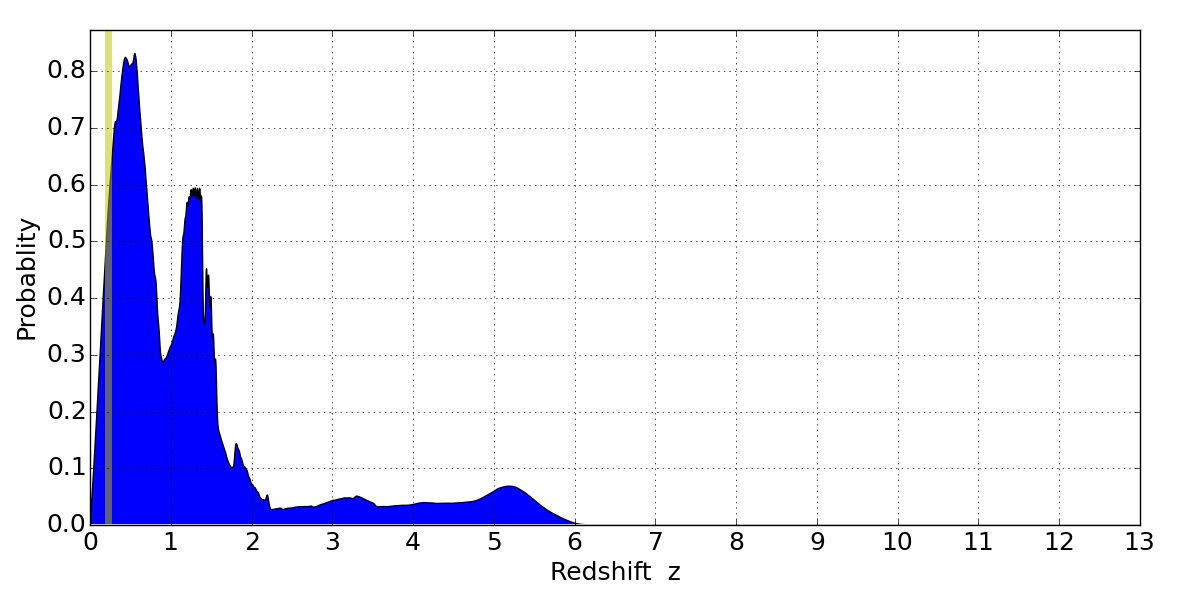
Color images and BPZ results
Catalog: 501.cat
Black segments are analyzed here. Roll mouse over color images to view segments.
Best viewed in a wide browser window (1200 pixels or more). Download SED & P(z) plots to view larger versions.
In P(z) plots: Yellow lines mark the cluster redshift z = 0.228,
Object #501 x,y = (2450, 2506) RA, Dec = (13:35:19.320, 40:59:58.20) = (203.83050, 40.99950) BPZ = 0.554 [0.146--5.246] type = 7.00 (Scd_B10) chisq2 = 1.05 ODDS = 0.10 z_cluster = 0.228