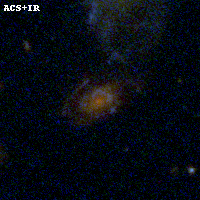
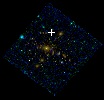
ABELL1763 IR detection object #50
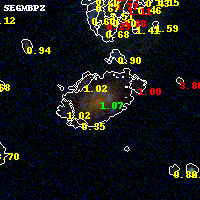
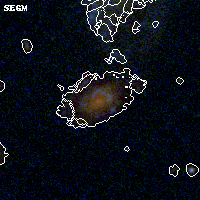
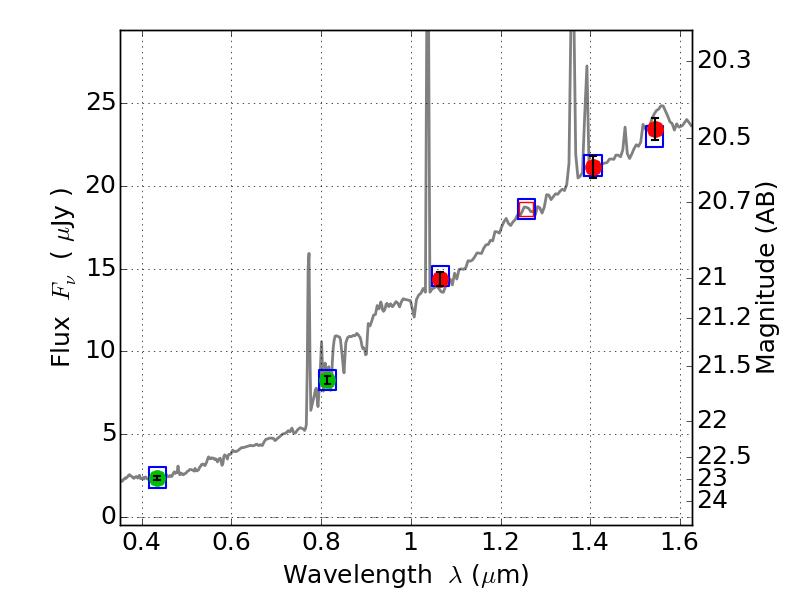
Color images and BPZ results
Catalog: 50.cat
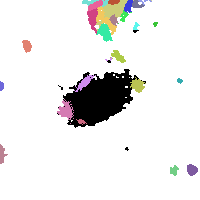
Black segments are analyzed here. Roll mouse over color images to view segments.
Best viewed in a wide browser window (1200 pixels or more). Download SED & P(z) plots to view larger versions.
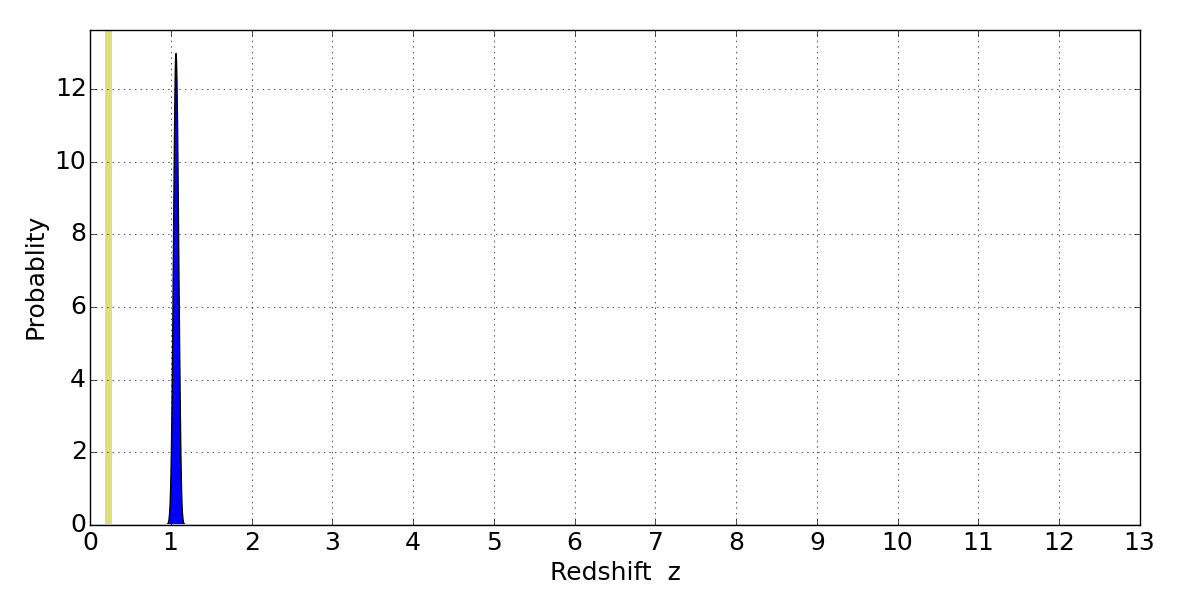
In P(z) plots: Yellow lines mark the cluster redshift z = 0.228,
Object #50 x,y = (2594, 3418) RA, Dec = (13:35:18.552, 41:00:52.92) = (203.82730, 41.01470) BPZ = 1.066 [1.007--1.124] type = 7.20 (Scd_B10 - SB1_B10) chisq2 = 0.04 ODDS = 1.00 z_cluster = 0.228