ABELL1763 IR detection object #300
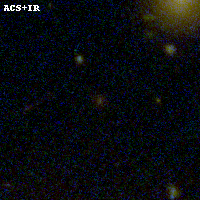
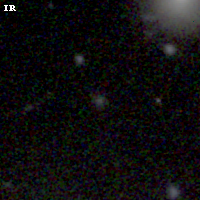
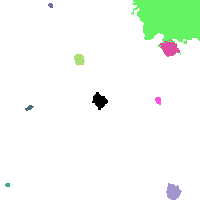
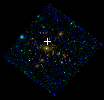
Color images and BPZ results
Catalog: 300.cat
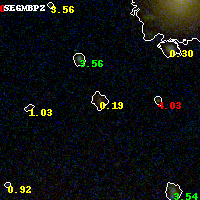
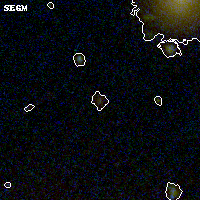
Black segments are analyzed here. Roll mouse over color images to view segments.
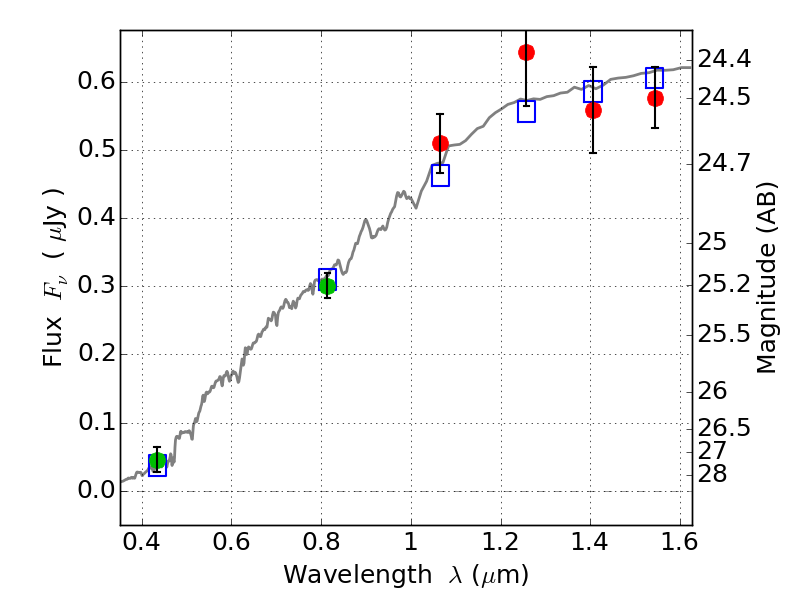
Best viewed in a wide browser window (1200 pixels or more). Download SED & P(z) plots to view larger versions.
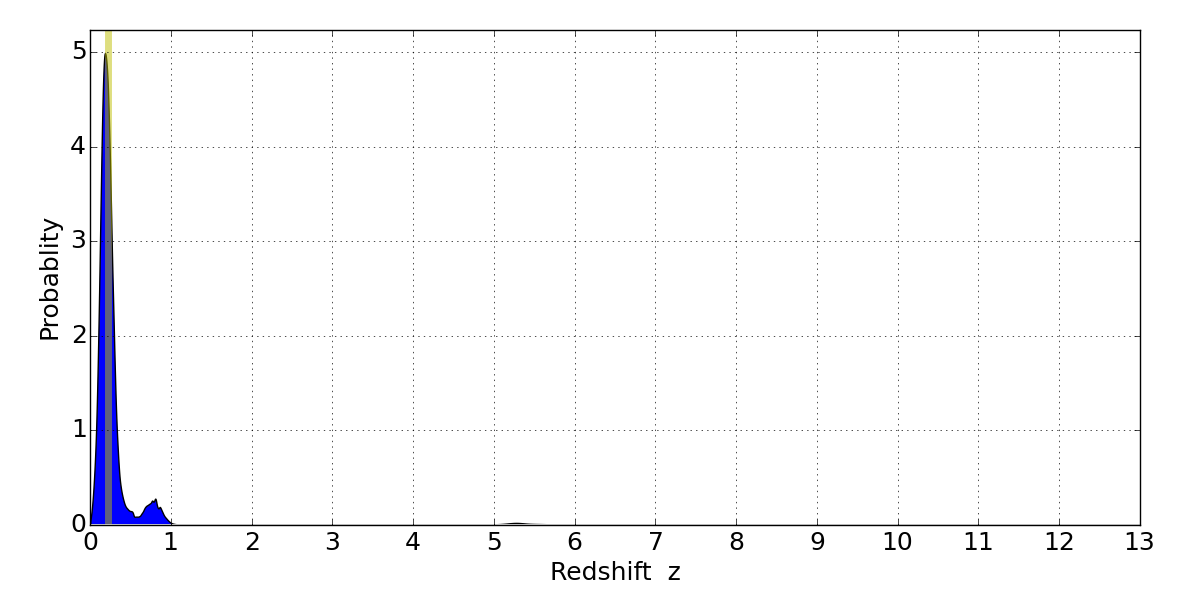
In P(z) plots: Yellow lines mark the cluster redshift z = 0.228,
Object #300 x,y = (2367, 2956) RA, Dec = (13:35:19.752, 41:00:25.20) = (203.83230, 41.00700) BPZ = 0.192 [0.077--0.837] type = 2.20 (Ell6_A_0 - Ell5_A_0) chisq2 = 0.68 ODDS = 0.45 z_cluster = 0.228