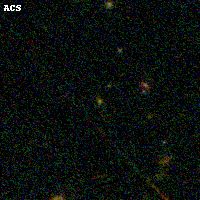
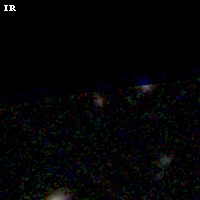
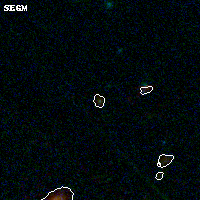
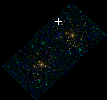
ABELL1758 IR detection object #50
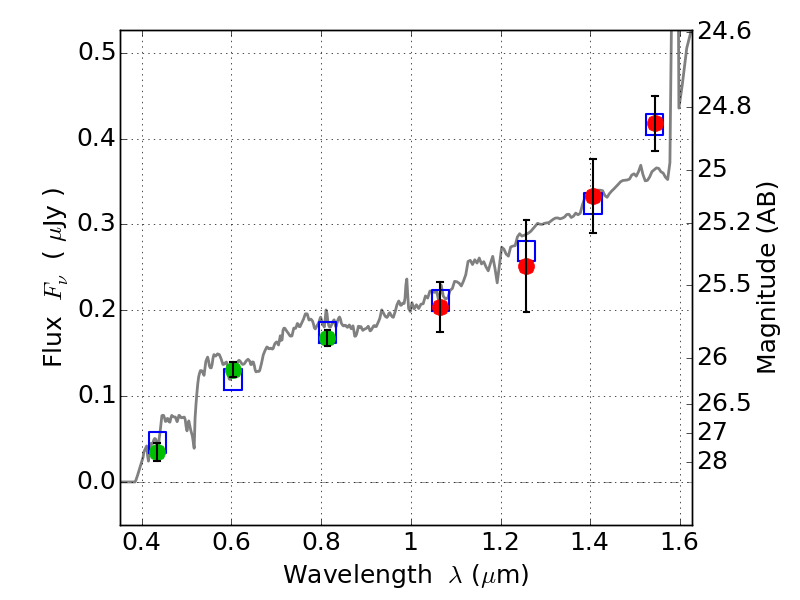
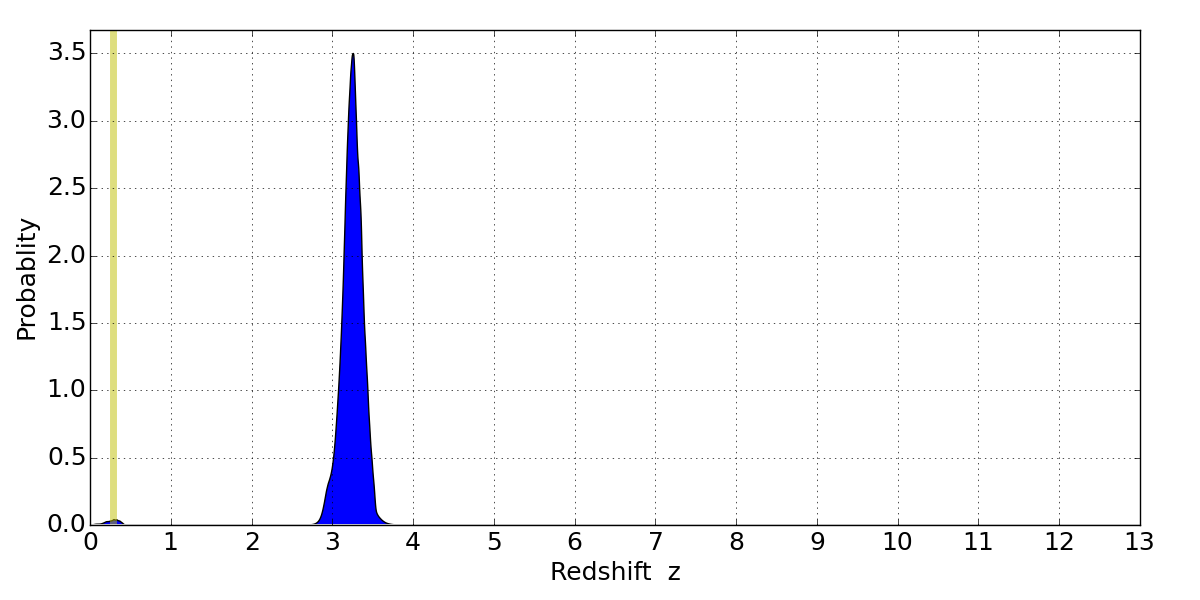
Color images and BPZ results
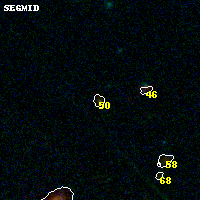
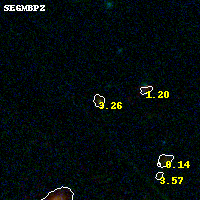
Catalog: 50.cat
Black segments are analyzed here. Roll mouse over color images to view segments.
Best viewed in a wide browser window (1200 pixels or more). Download SED & P(z) plots to view larger versions.
In P(z) plots: Yellow lines mark the cluster redshift z = 0.280,
Object #50 x,y = (4119, 5572) RA, Dec = (13:32:44.232, 50:34:37.56) = (203.18430, 50.57710) BPZ = 3.261 [2.944--3.485] type = 7.60 (SB1_B10 - Scd_B10) chisq2 = 0.13 ODDS = 0.82 z_cluster = 0.280