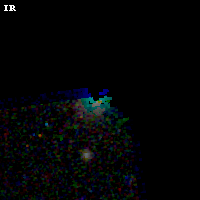
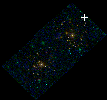
ABELL1758 IR detection object #13
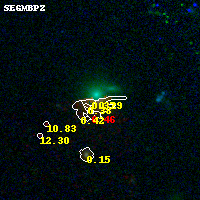
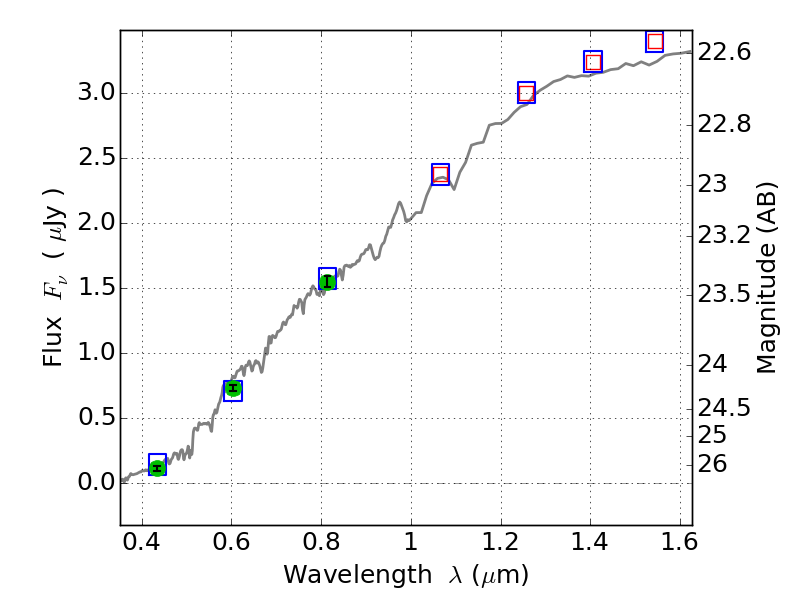
Color images and BPZ results
Catalog: 13.cat
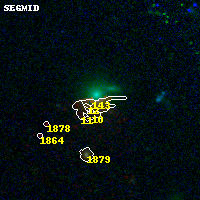
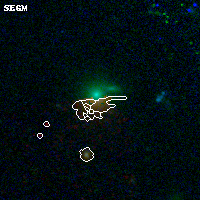
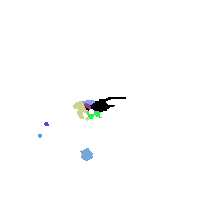
Black segments are analyzed here. Roll mouse over color images to view segments.
Best viewed in a wide browser window (1200 pixels or more). Download SED & P(z) plots to view larger versions.
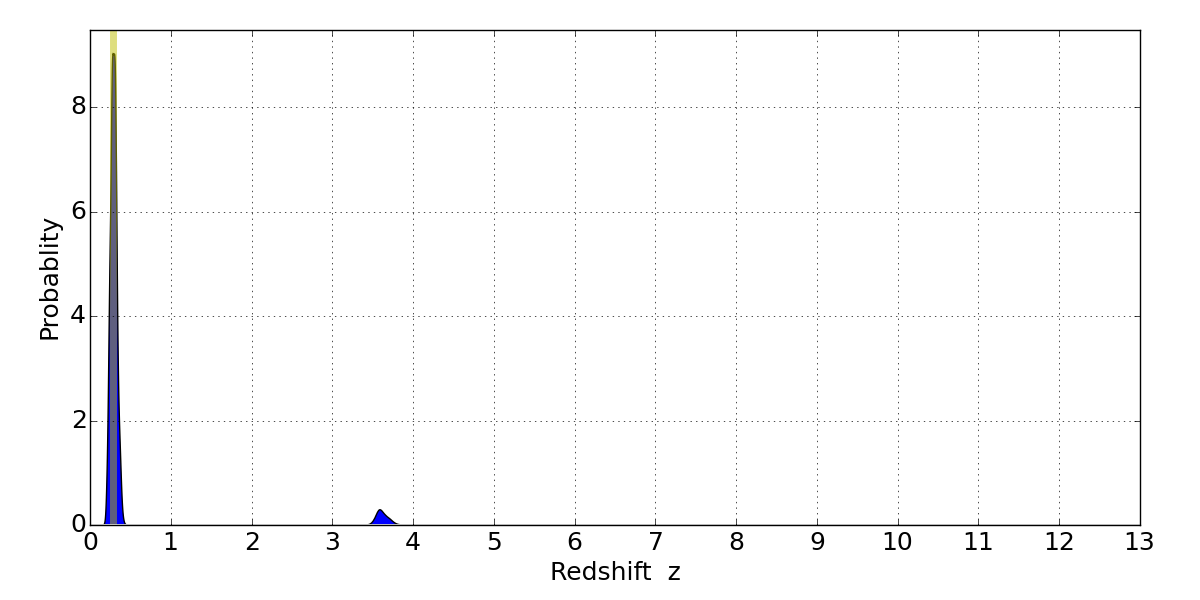
In P(z) plots: Yellow lines mark the cluster redshift z = 0.280,
Object #13 x,y = (5937, 5823) RA, Dec = (13:32:32.784, 50:34:52.68) = (203.13660, 50.58130) BPZ = 0.286 [0.220--3.612] type = 2.00 (Ell6_A_0) chisq2 = 0.04 ODDS = 0.76 z_cluster = 0.280