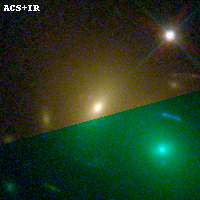
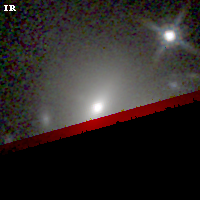
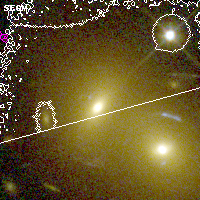
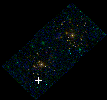
ABELL1758 ACS+IR detection object #1
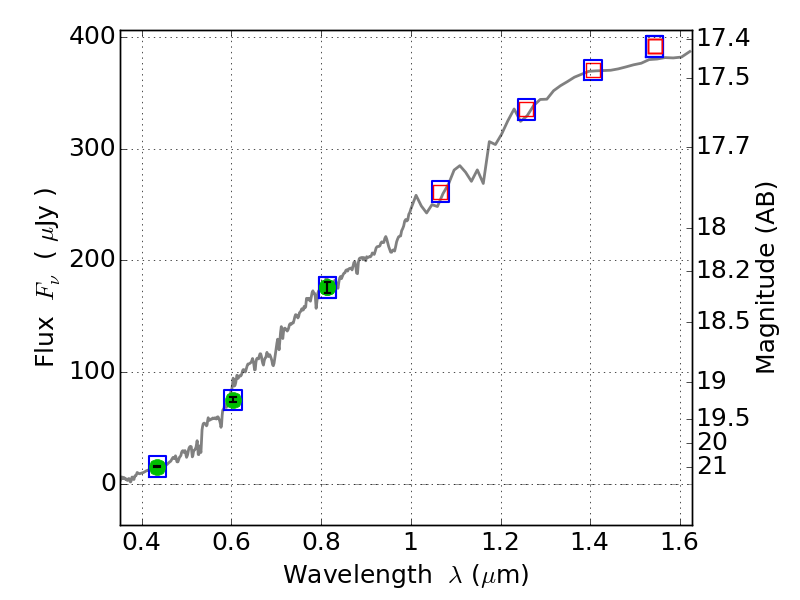
Color images and BPZ results
Catalog: 1.cat
Black segments are analyzed here. Roll mouse over color images to view segments.
Best viewed in a wide browser window (1200 pixels or more). Download SED & P(z) plots to view larger versions.
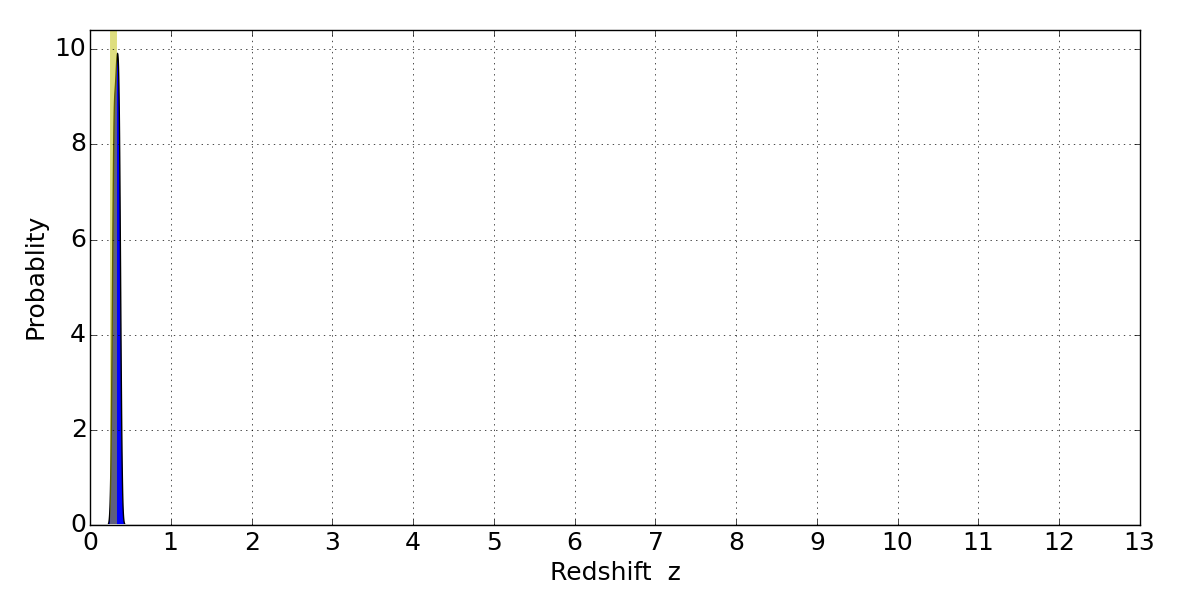
In P(z) plots: Yellow lines mark the cluster redshift z = 0.280,
Object #1 x,y = (2695, 1437) RA, Dec = (13:32:53.208, 50:30:29.52) = (203.22170, 50.50820) BPZ = 0.341 [0.265--0.391] type = 2.60 (Ell5_A_0 - Ell6_A_0) chisq2 = 0.00 ODDS = 0.86 z_cluster = 0.280