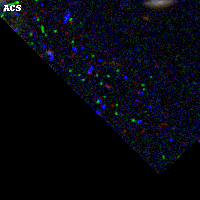
ABELL1758 ACS+IR detection object #1
Color images and BPZ results
Catalog: 1.cat
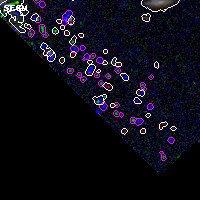
Black segments are analyzed here. Roll mouse over color images to view segments.
Best viewed in a wide browser window (1200 pixels or more). Download SED & P(z) plots to view larger versions.
In P(z) plots: Yellow lines mark the cluster redshift z = 0.280,
Object #1 x,y = (2419, 76) RA, Dec = (13:32:54.936, 50:29:07.80) = (203.22890, 50.48550) BPZ = 0.017 [0.010--0.034] type = 11.00 (SB11_A_0_l) chisq2 = 216.90 ODDS = 1.00 z_cluster = 0.280