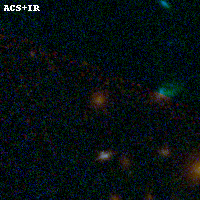
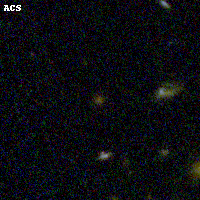
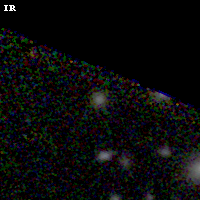
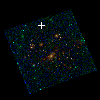
ABELL1300 IR detection object #3
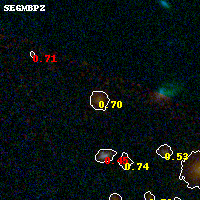
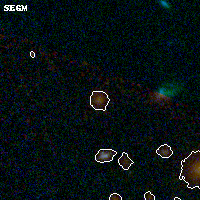
Color images and BPZ results
Catalog: 3.cat
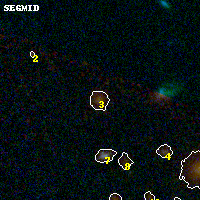
Black segments are analyzed here. Roll mouse over color images to view segments.
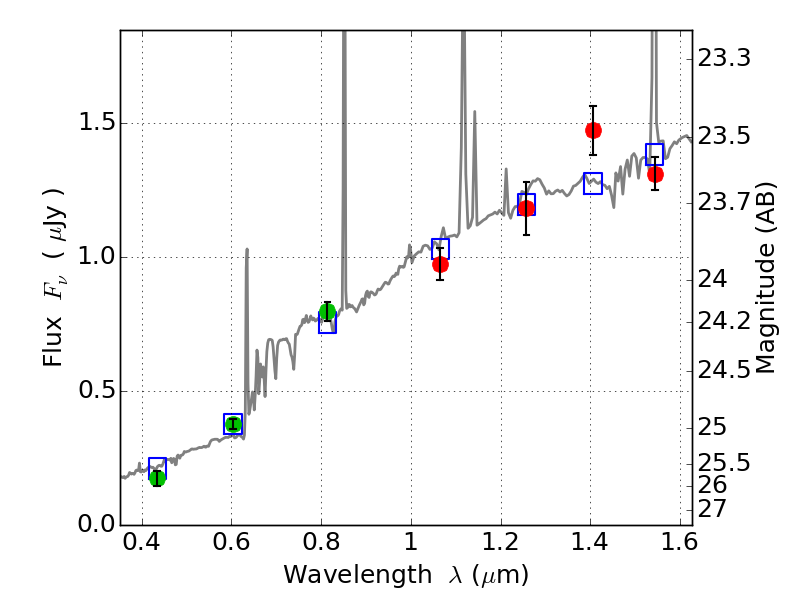
Best viewed in a wide browser window (1200 pixels or more). Download SED & P(z) plots to view larger versions.
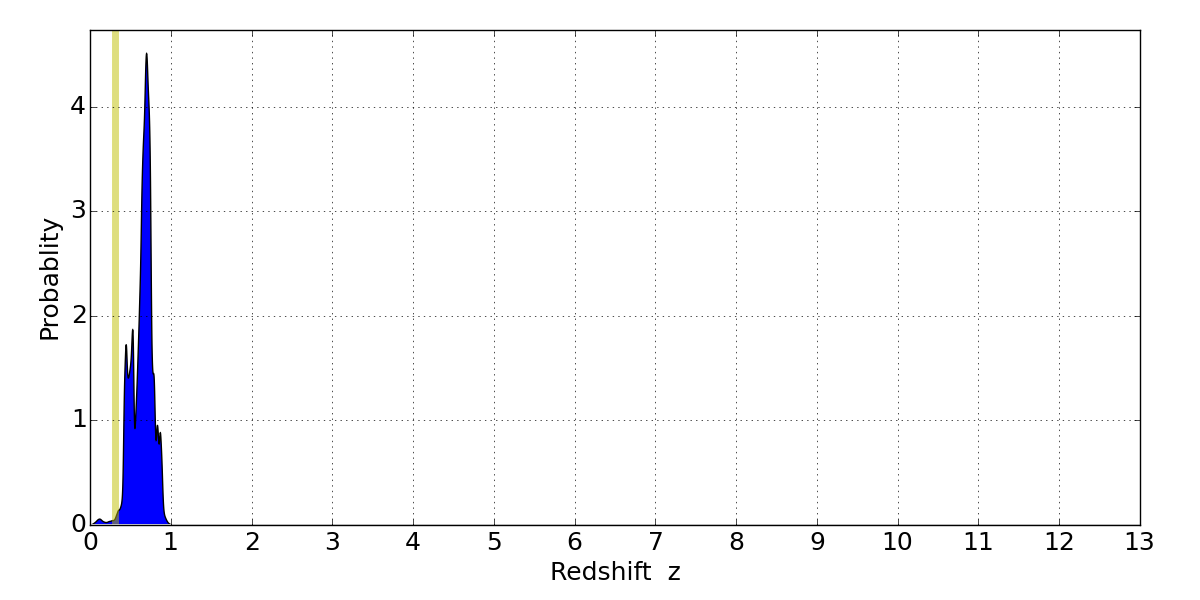
In P(z) plots: Yellow lines mark the cluster redshift z = 0.307,
Object #3 x,y = (2094, 3785) RA, Dec = (11:31:56.088, -19:54:05.76) = (172.98370, -19.90160) BPZ = 0.701 [0.407--0.874] type = 7.80 (SB1_B10 - Scd_B10) chisq2 = 0.84 ODDS = 0.50 z_cluster = 0.307