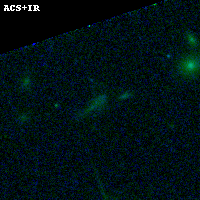
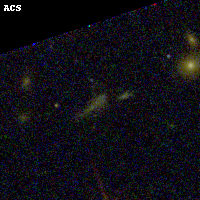
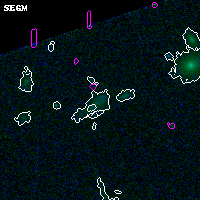
ABELL1300 ACS+IR detection object #900
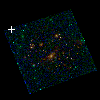
Color images and BPZ results
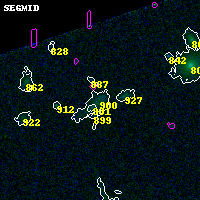
Catalog: 900.cat
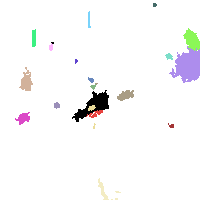
Black segments are analyzed here. Roll mouse over color images to view segments.
Best viewed in a wide browser window (1200 pixels or more). Download SED & P(z) plots to view larger versions.
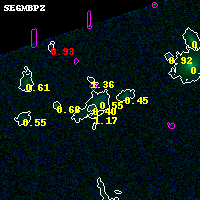
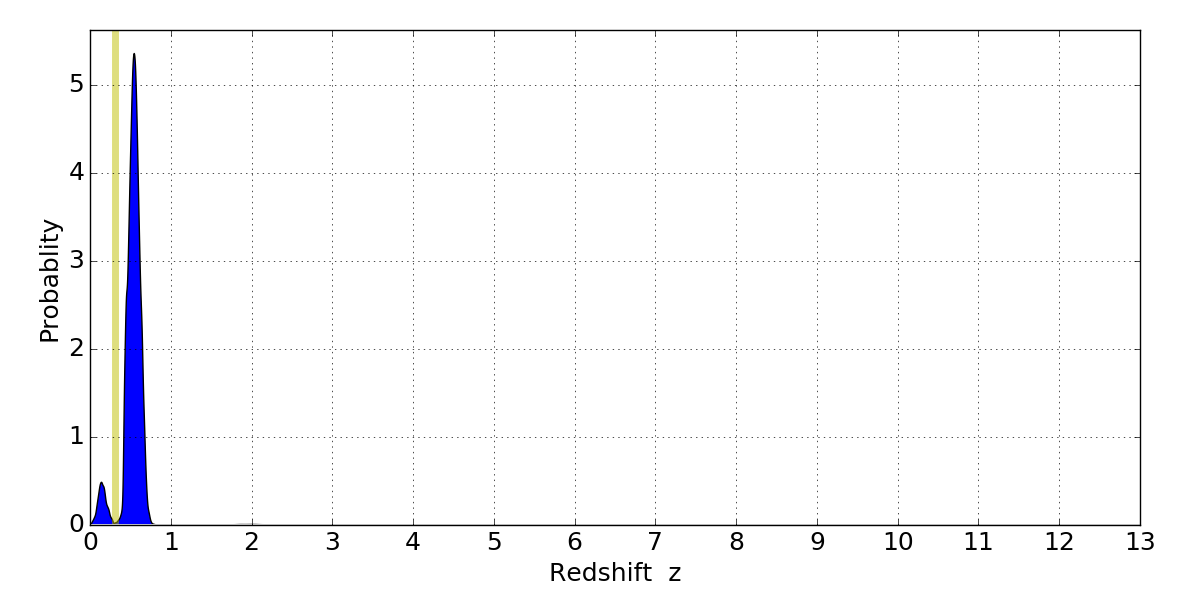
In P(z) plots: Yellow lines mark the cluster redshift z = 0.307,
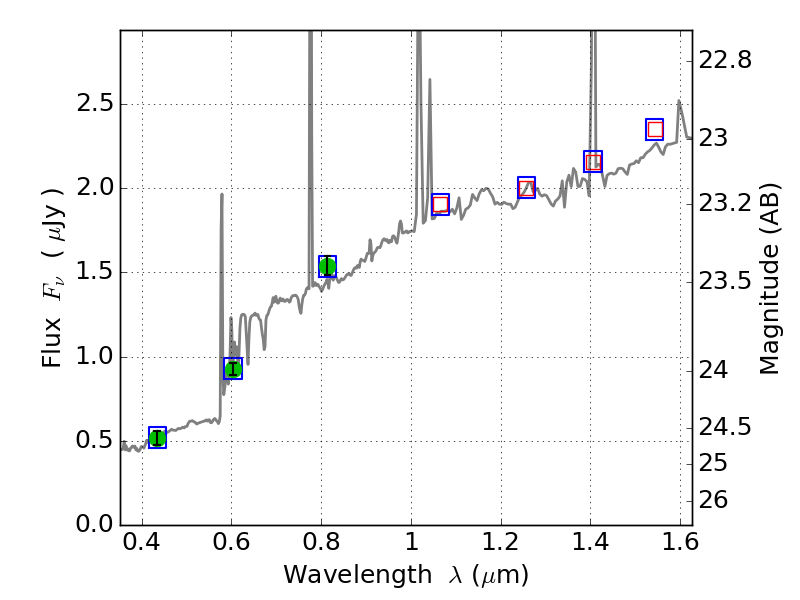
Object #900 x,y = (598, 3556) RA, Dec = (11:32:02.448, -19:54:19.44) = (173.01020, -19.90540) BPZ = 0.547 [0.137--0.685] type = 8.40 (SB1_B10 - SB2_B10) chisq2 = 0.00 ODDS = 0.57 z_cluster = 0.307