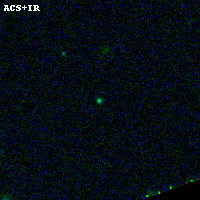
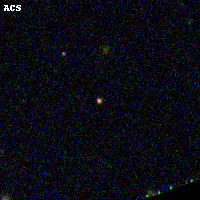
ABELL1300 ACS+IR detection object #5110
Color images and BPZ results
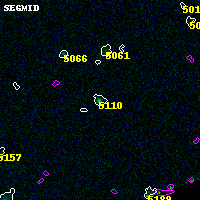
Catalog: 5110.cat
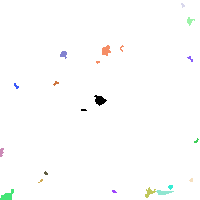
Black segments are analyzed here. Roll mouse over color images to view segments.
Best viewed in a wide browser window (1200 pixels or more). Download SED & P(z) plots to view larger versions.
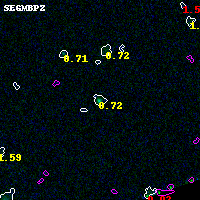
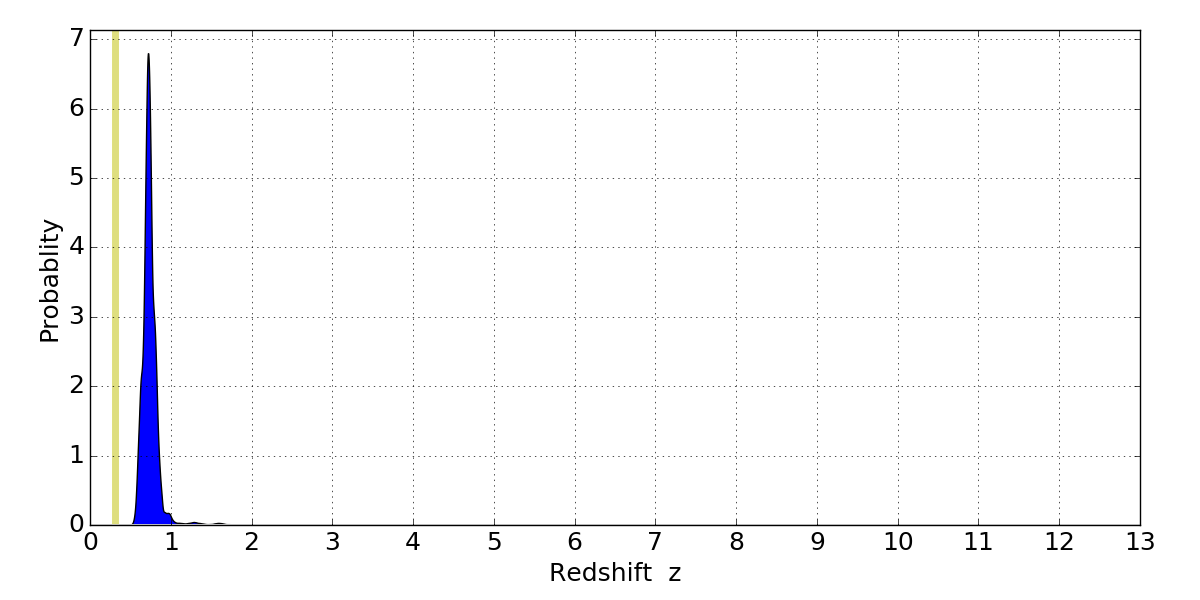
In P(z) plots: Yellow lines mark the cluster redshift z = 0.307,
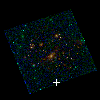
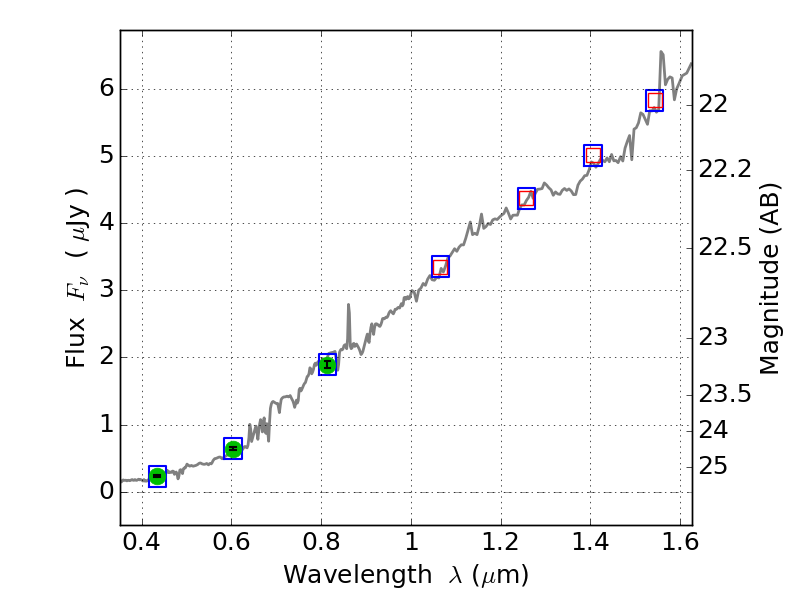
Object #5110 x,y = (2820, 918) RA, Dec = (11:31:52.992, -19:56:57.84) = (172.97080, -19.94940) BPZ = 0.725 [0.598--0.950] type = 6.10 (Sbc_B10 - Scd_B10) chisq2 = 0.00 ODDS = 0.67 z_cluster = 0.307