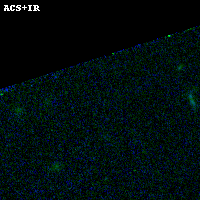
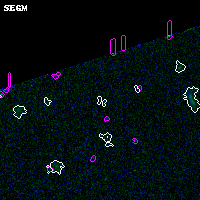
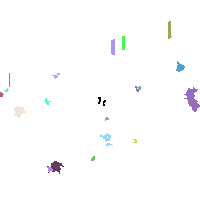
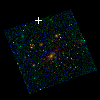
ABELL1300 ACS+IR detection object #300
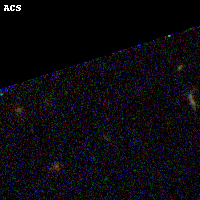
Color images and BPZ results
Catalog: 300.cat
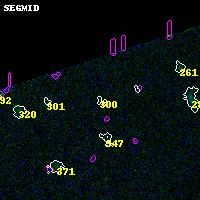
Black segments are analyzed here. Roll mouse over color images to view segments.
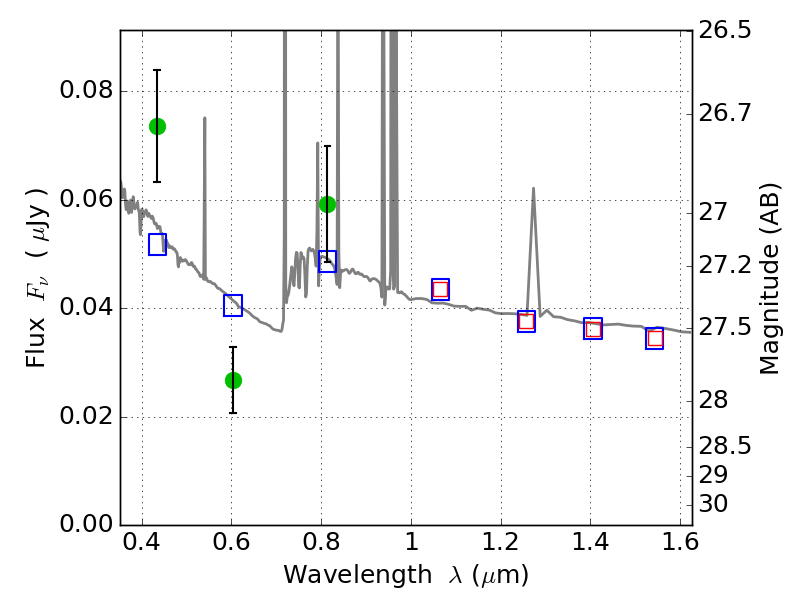
Best viewed in a wide browser window (1200 pixels or more). Download SED & P(z) plots to view larger versions.
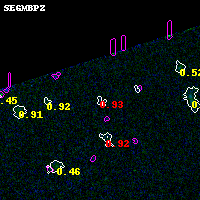
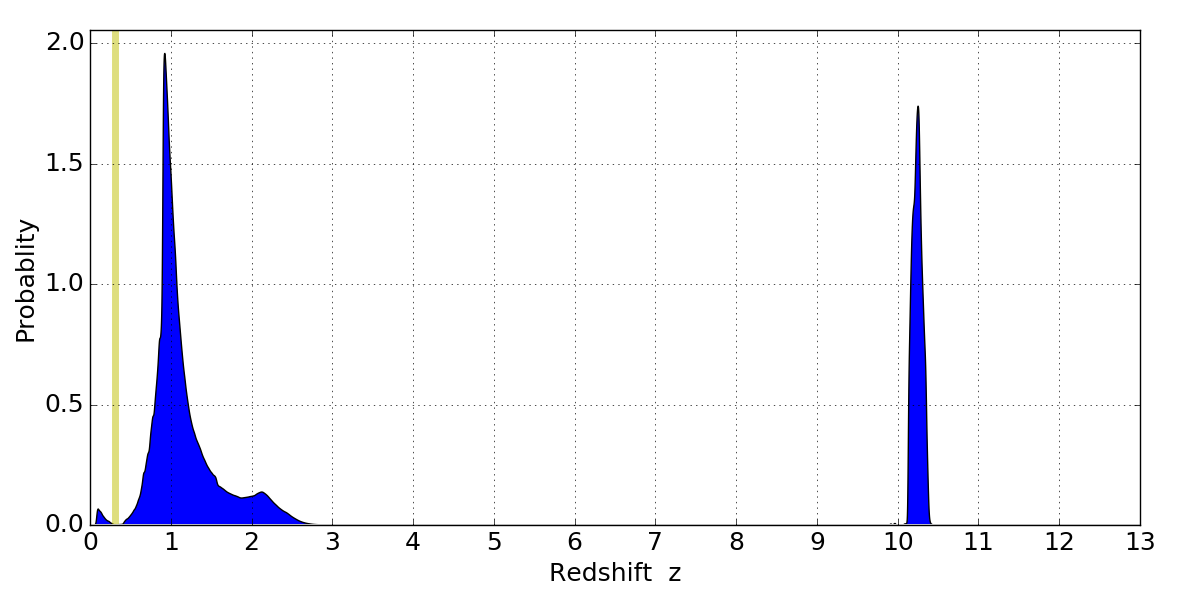
In P(z) plots: Yellow lines mark the cluster redshift z = 0.307,
Object #300 x,y = (1932, 4028) RA, Dec = (11:31:56.784, -19:53:51.00) = (172.98660, -19.89750) BPZ = 0.926 [0.663--10.332] type = 11.00 (SB11_A_0_l) chisq2 = 8.78 ODDS = 0.22 z_cluster = 0.307