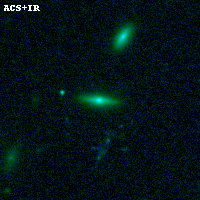
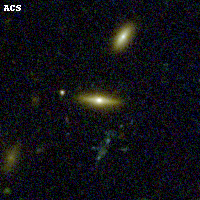
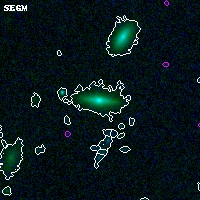
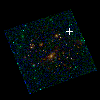
ABELL1300 ACS+IR detection object #1000
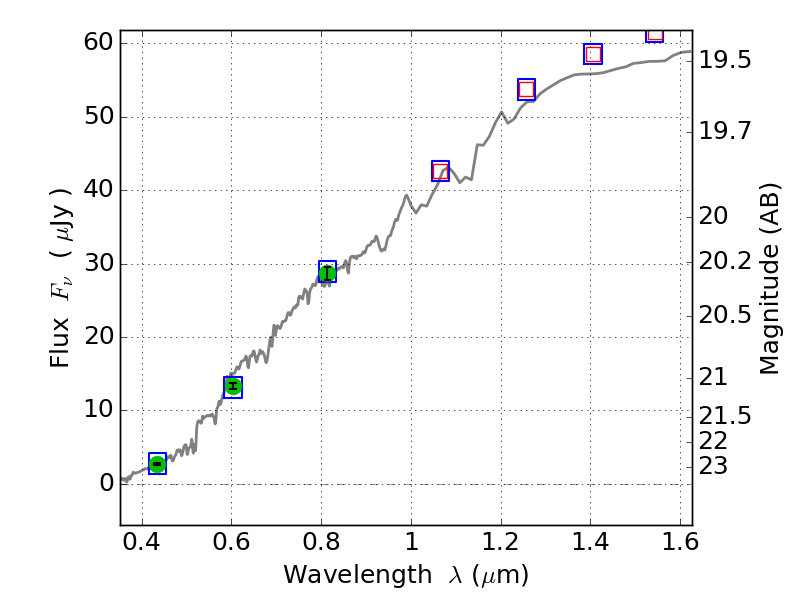
Color images and BPZ results
Catalog: 1000.cat
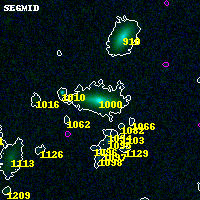
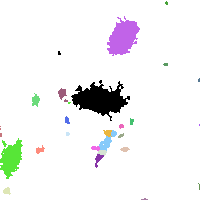
Black segments are analyzed here. Roll mouse over color images to view segments.
Best viewed in a wide browser window (1200 pixels or more). Download SED & P(z) plots to view larger versions.
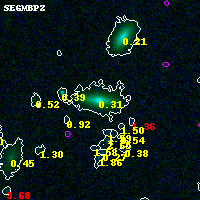
In P(z) plots: Yellow lines mark the cluster redshift z = 0.307,
Object #1000 x,y = (3453, 3472) RA, Dec = (11:31:50.304, -19:54:24.48) = (172.95960, -19.90680) BPZ = 0.314 [0.220--0.365] type = 3.00 (Ell5_A_0) chisq2 = 0.01 ODDS = 0.79 z_cluster = 0.307