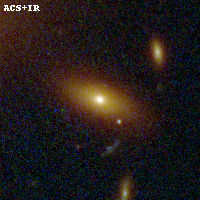
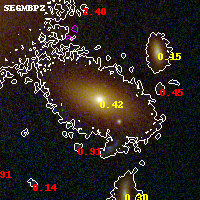
ABELL1300 ACS+IR detection object #1
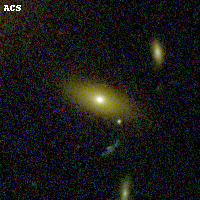
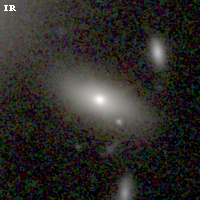
Color images and BPZ results
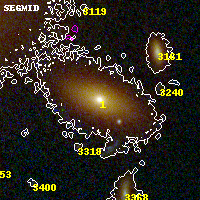
Catalog: 1.cat
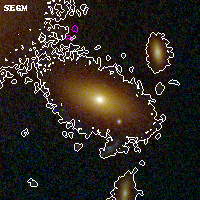
Black segments are analyzed here. Roll mouse over color images to view segments.
Best viewed in a wide browser window (1200 pixels or more). Download SED & P(z) plots to view larger versions.
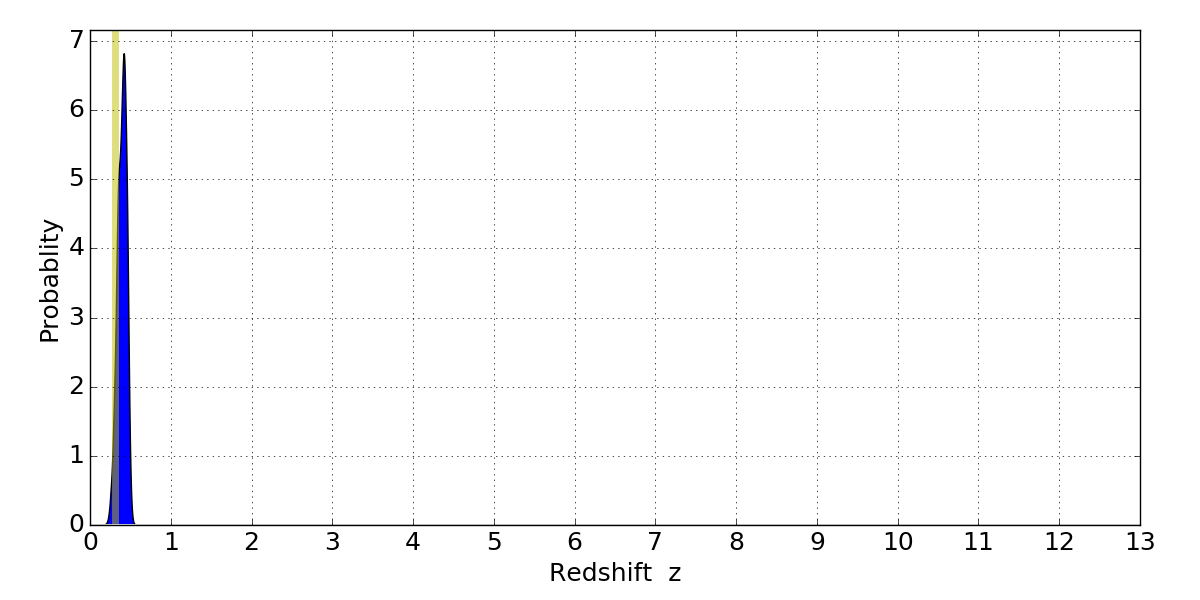
In P(z) plots: Yellow lines mark the cluster redshift z = 0.307,
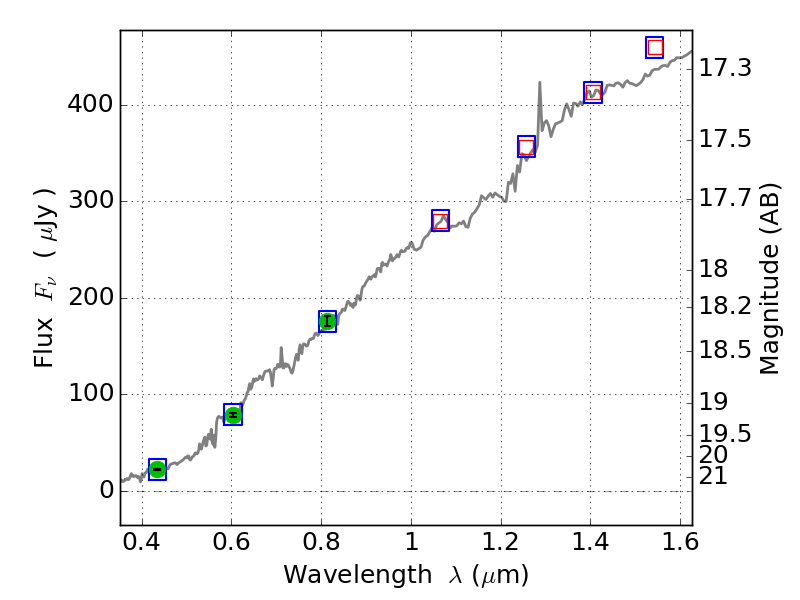
Object #1 x,y = (2743, 2135) RA, Dec = (11:31:53.328, -19:55:44.76) = (172.97220, -19.92910) BPZ = 0.423 [0.281--0.495] type = 5.90 (Sbc_B10 - ES0_B10) chisq2 = 0.00 ODDS = 0.65 z_cluster = 0.307