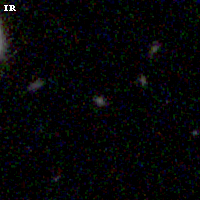
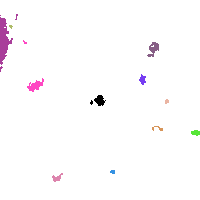
ABELL2537 ACS+IR detection object #1073
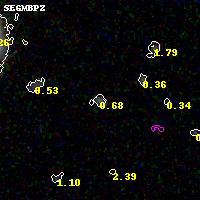
Color images and BPZ results
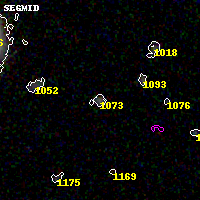
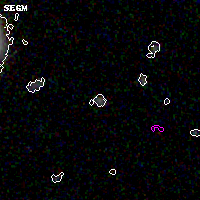
Catalog: 1073.cat
Black segments are analyzed here. Roll mouse over color images to view segments.
Best viewed in a wide browser window (1200 pixels or more). Download SED & P(z) plots to view larger versions.
In P(z) plots: Yellow lines mark the cluster redshift z = 0.297,
Object #1073 x,y = (1961, 4131) RA, Dec = (23:08:22.896, -2:10:41.52) = (347.09540, -2.17820) BPZ = 0.684 [0.064--1.437] type = 8.60 (SB2_B10 - SB1_B10) chisq2 = 0.20 ODDS = 0.30 z_cluster = 0.297